
I recapped here what is new with Lumira 2.1 and it was GA on Friday. I also wrote yesterday what is new in SAP Lumira Discovery.
Commentary
Commentary is at the data level, application based, cell commentary with three levels of commentary on the BI platform
Use the new samples that come with 2.1 to see:

There is a new Dashboard Sample and Feature Samples. To try the commentary, I use the Dashboard Sample and it shows on the right what it contains

Execute the application locally and in the upper right you can see the Comments icon

This is an example of an application level comment. Comments can be personal (only you can see them) or Global (those who have access to the application can see them).
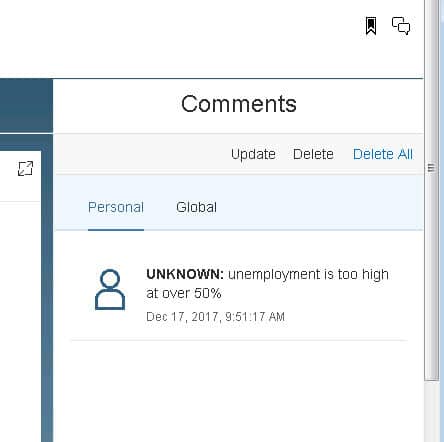
Clicking insert will update the comments. UNKNOWN is the user because application is running local mode

I can filter down in the map and make filter-level comments

Filter level comments are shown in the right
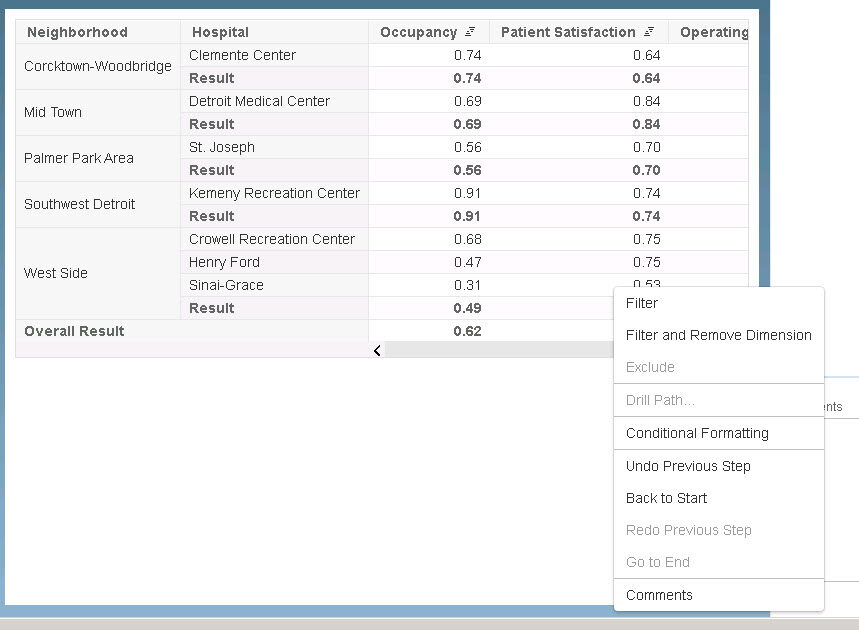
In the crosstab you can also make cell level comments using the context menu
Sample Composites

One sample composite is the Card composite which is a KPI tile

The above is a sample application composite card

You can set properties at run time

Above is an example of going full screen on the chart and chart interactions
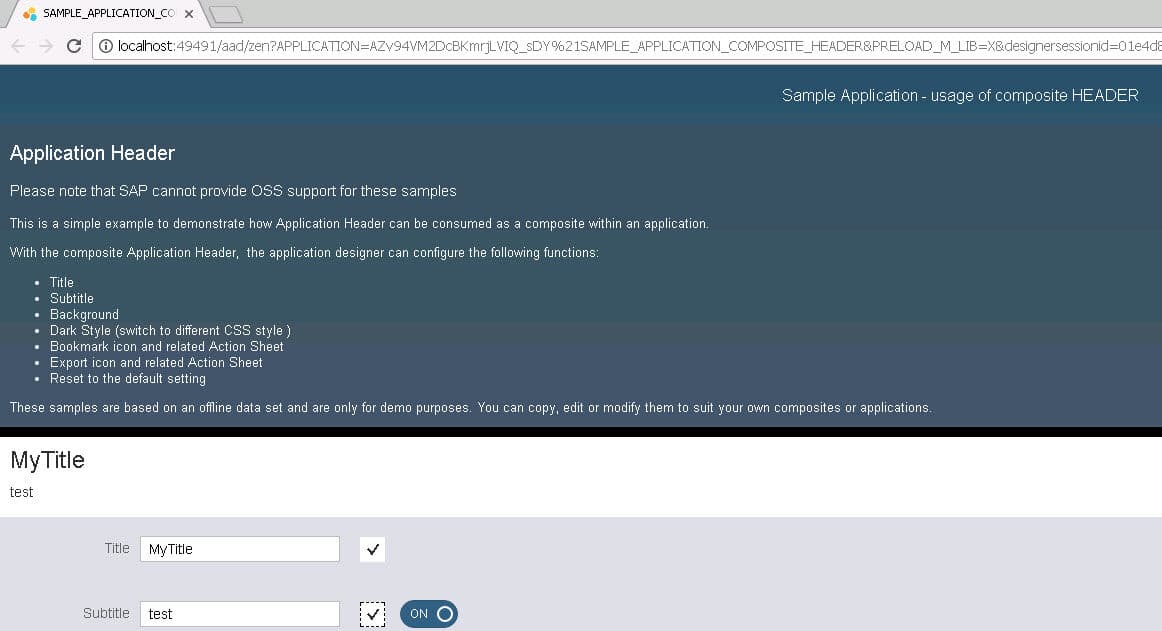
Above is another sample composite for the header and you can change properties
Enhanced Conditional Formatting

Looks like you can see the BEx conditional formatting rules
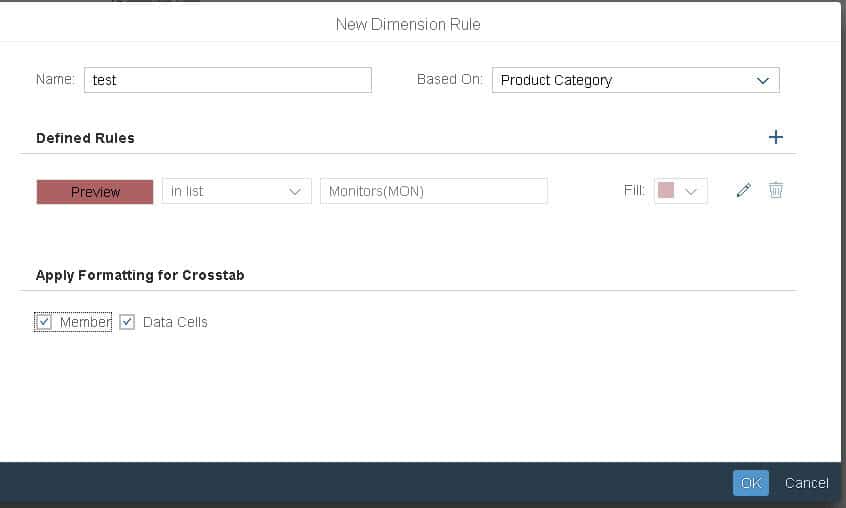
The above is a conditional formatting using a dimension rule, highlighting the monitor product category (using the SAP NetWeaver Demo model BEx query as a data source)
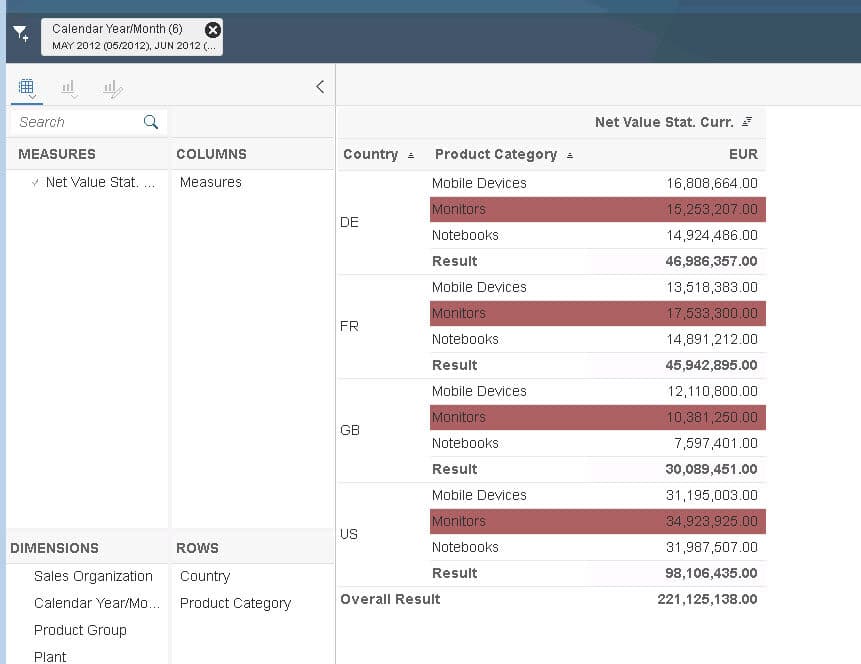
Above is the result of the conditional formatting, highlighting the monitors
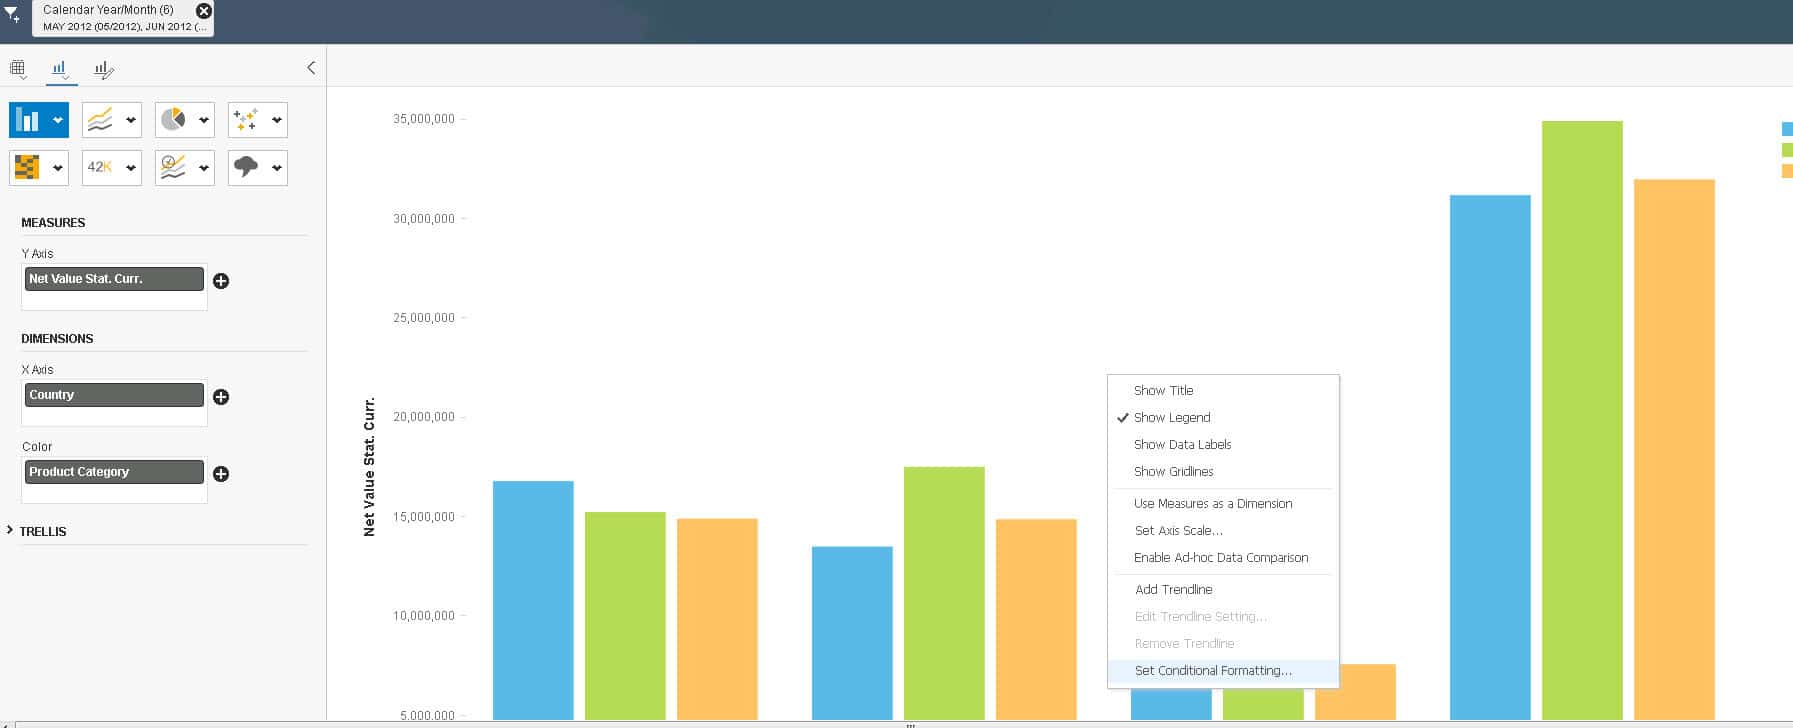
You can change it to a graph and set the same conditional formatting rule on the graph

Click apply to set it on the graph
Filter by Measure
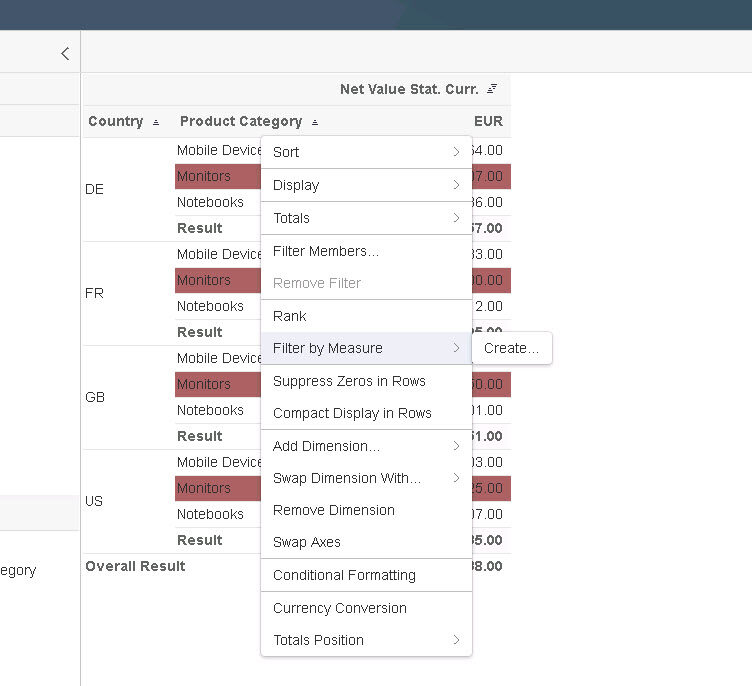
Similar to Lumira Discovery 2.1 you can filter by measure


Above is an example of the result of filtering by measure

Attribute Support for Filter by Dialog
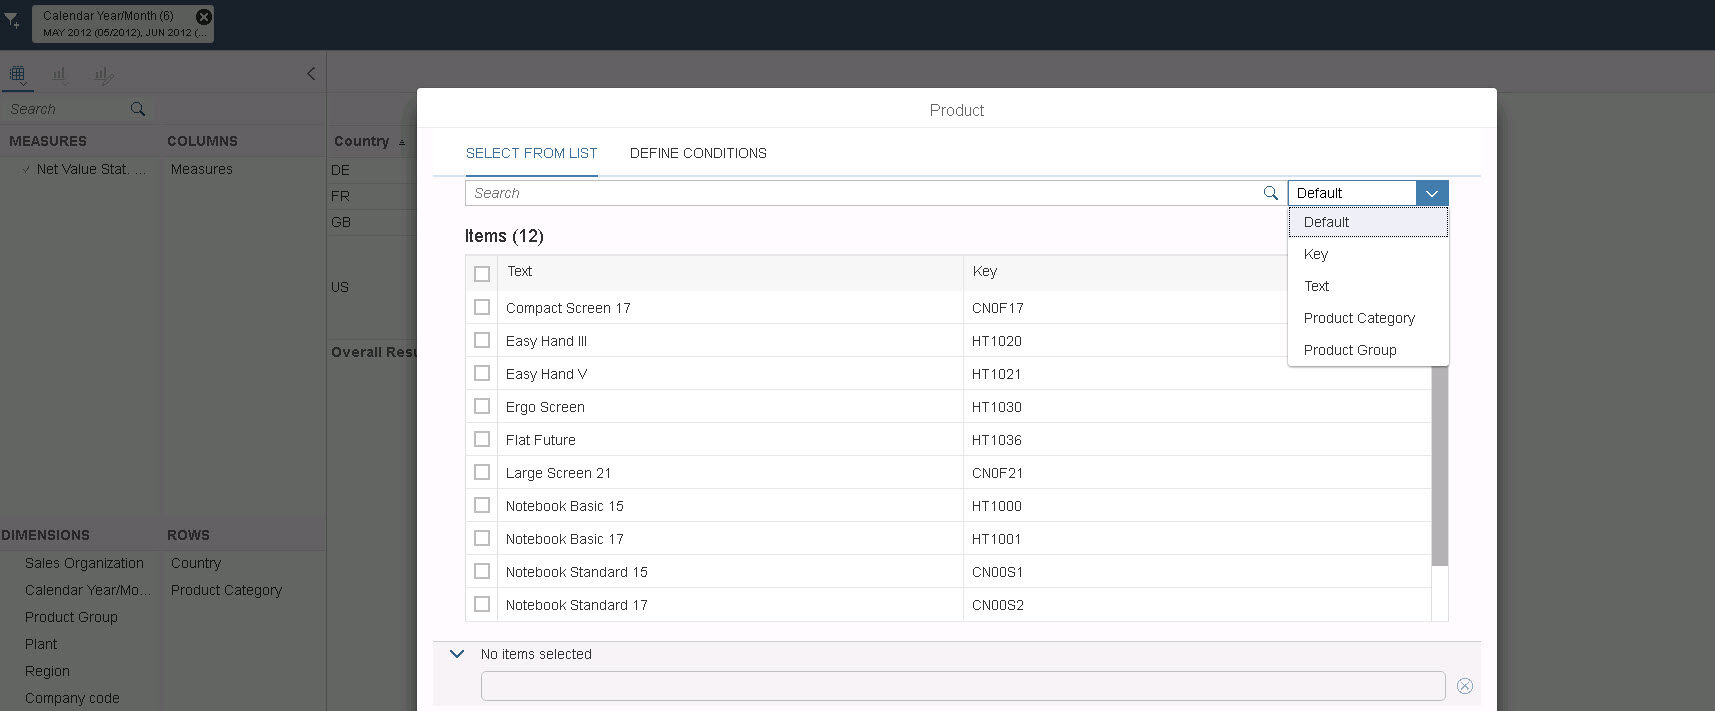
You can see the product filter has attributes of product category and product group

Select the gear icon to add the product category and group attributes to the filter search dialog

Now you can see product category and product group attributes added added to the product filter dialog
Enhanced Export to PDF
“Fit to page” is new, so if you have a crosstab with several columns you can have the export to PDF fit to page

Above is the crosstab
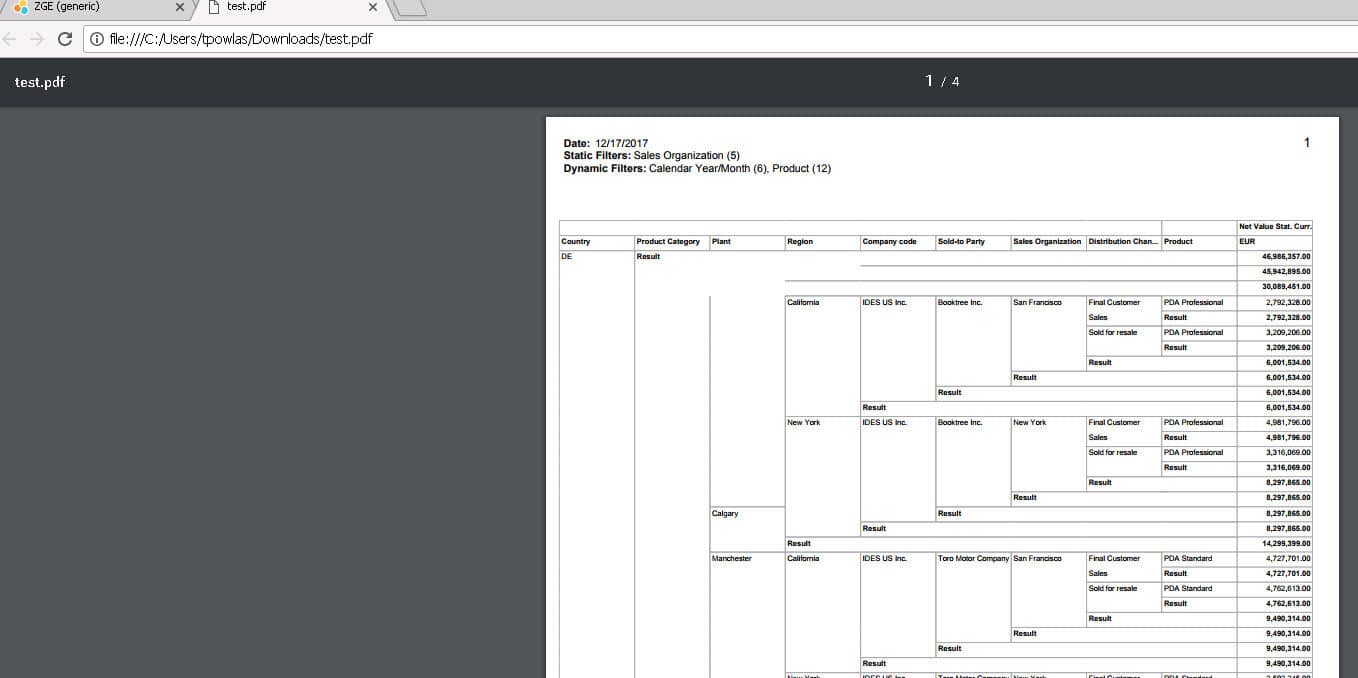
Now you can see where it has fit on the PDF export.
Scrollable Container
The Dashboard Sample has an example of the scrollable container:

See the arrow pointing to the scrollable container.
There are more features, listed here.
Upcoming Items of Interest
You can learn more here:
Trying what is new in SAP Lumira Designer 2.1