
Hi All,
Today I want to talk about some Performance tips in SAP HANA Calculation View.
Our basic aim to move to SAP HANA is performance and if performance is not so good then there is no meaning to a shift. Creating information views in HANA is not a big deal, however maintaining their performance is what needs time and understanding of various options SAP HANA provides.
First and foremost is SAP HANA’s engine, HANA provides three engines JOIN Engine, OLAP Engine and Calculation Engine. Apart from this there is one SAP HANA Query optimizer whose job is to actually handover data to separate engines depending on which engine performs better for that query.
When building Calculation Views, it is useful to Keep in mind that which engine is predominantly used( Just to give an example if the Calculation View is of type dimension, processing goes to Join Engine, however if there is any calculated column then processing goes to Calculation Engine which sits on top of JOIN Engine. Similarly if the View is of type CUBE with Star Join then processing goes to OLAP Engine).
There are quite a lot of overlapping capabilities in engines and to identify which engine(s) or are actually called. One thing is we can using Explain Plan Tool (explained below) to see which engine is used at which step
Some points which can be taken care of – while doing modelling
- Try not to transfer larger result sets between HANA DB and Client Applications( ex. Analysis for Office)
- Always try to do calculation after Aggregation (Aggregation removes duplicate results or aggregated them)
- One more thing is – try to avoid Complex Expression in Calculated column, either one can push down this into model itself
- Doing JOINs on key or indexed column helps a lot in performance
- Most important is Filter data as early as possible by using input parameters, Analytical Privileges, Aggregations, etc.
- Also try to reduce data flow between views.
Apart from this one can use Execute In property in Views (present in view’s property tab), if you set it to SQL Engine then Calculation Engines try to generate SQL statements for each nodes and then create a big SQL query which then passes to SQL Query interface which has standard SQL optimizer which helps in optimizing SQL query (one is that it generates optimal JOIN sequence).
To have this SQL optimizer works you need to make sure that you should not use any column store functions in filter or calculated columns (ex. date(), time() )
I will talk about SQL script optimization in another blog.
Before ending this blog let me tell you about some tools which helps in monitoring performance
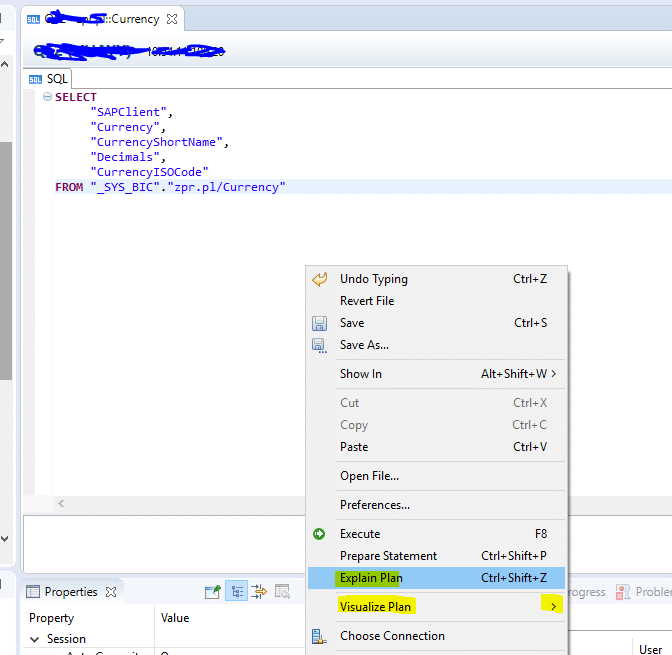
- One is Explain Plan tool : In this you can see which execution step uses which Engine, through this you can avoid calling multiple engines by tweaking nodes in view, hence gives good performance.
- Another is Plan Visualize tool: I very much like this tool as it gives the complete picture of how the data is flowing in a view, how much rows of data is moving from one node to another.
- Next is Plant Execute tool : In this you can see Execution time, which node is taking maximum time, how many tables were accessed, how many records, etc. I will recommend to see this when your are executing your views.
- Timeline View: This gives time stamps for each SQL execution step. This is also a good view to see which step is taking maximum time.
Finally to see these tool you have to actually generate the SQL query of View, which you can generate by right clicking on the view and click on option Generate Select SQL. Now in the context menu you have options to select different tools (as shown below).
I hope this helps you when you are concerned about performance.
In case of any query regarding this feel free to add comments below, I will address then to best of my knowledge.
Thanks,
Yogesh Vijay
New NetWeaver Information at SAP.com
Very Helpfull